Contributed by Graduate Student Olin Green
Earlier this year, I was fortunate to have been awarded the 2024-2025 El Instituto Predoctoral Fellowship, supported by the Elizabeth Mahan Fund. These awards allowed me to continue my research during the summer on a project titled The Hidden Dimensions of Road Safety: Exploring Socioeconomic and Built Environment Factors in Latin American and Underserved Communities, which examines how characteristics of the built environment and driver behavior contribute to the inequitable distribution of crashes and near-crashes in underserved areas. This analysis uses real-world driving data collected from individuals through the SHRP2 Naturalistic Driving Study (NDS), which includes numerous variables that describe the behavior, characteristics, and performance of drivers. Even though this data is available for several cities in the United States, it was only obtained for Hillsborough and Pinellas Counties in Florida due to this area’s diversity in socioeconomic and transportation-related characteristics, which may disproportionately impact residents of underserved communities due to their intersectional nature. To determine the characteristics of areas where disparities in safety occur, I clustered (i.e., grouped) each census tract in the study area based on socioeconomic and transportation-related characteristics. Three of these clusters had high population of Hispanic or Latino or Black or African Americans, and a brief description of these clusters can be found below:
- Cluster 2: more Hispanic/Latino residents, younger population
- Cluster 4: more Black/African American residents, less economically secure, more public transit commuters
- Cluster 5: more Black/African American residents, more public transit commuters, higher walkability
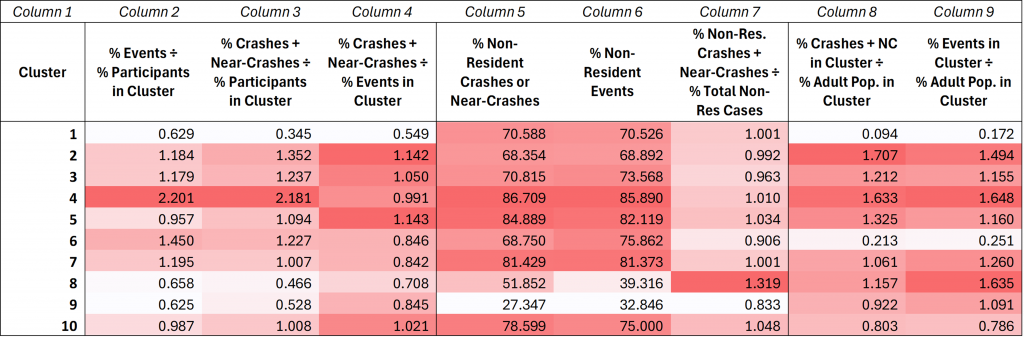
Each case in the NDS data is referred to as an “event” and each event is categorized based on its severity. Safety-critical events include crashes and near-crashes (i.e., a circumstance that required the driver of the vehicle to perform some sort of evasive maneuver to avoid a crash). Since each event was tagged with the cluster in which it occurred, I aggregated the events within each cluster and calculated a series of percentages and ratios to identify areas where disparities may occur. These values can be found in Table 1. Here, Column 1 indicates the cluster in which the events occurred, and the other columns contain either percentages or relative ratios. Columns 2 and 3, which visualize the relationship between the percentage of events or the percentage of crashes and near-crashes in each cluster to the percentage of participants, contain several ratios greater than 1.0. This indicates that these clusters have a higher percentage of events or crashes and near-crashes compared to the percentage of participants who live in that cluster. For example, the percentage of crashes and near-crashes in clusters 2 and 4 are 1.352 and 2.181 times higher than the percentage of participants. When comparing the percentage of crashes and near-crashes (Column 3), we can see that a higher percentage of events result in crashes or near-crashes in clusters 2 and 5, while clusters 1, 6, 7, 8, and 9 have lower crash or near-crash probability.
When looking at the values in Table 1, specifically columns 3, 5, and 8, crashes and near-crashes disproportionately occurred in areas with high Hispanic or Latino or Black or African American population (i.e., clusters 2, 4, and 5). Relative to both the population and number of participants, these areas have a significantly higher percentage of crashes and near-crashes, and most of these safety-critical events involve non-resident (e.g., more than 86% of crashes in Cluster 4 involve non-resident drivers). These findings indicate that people living in clusters 2, 4, and 5 are overexposed to roadway safety inequities involving drivers who live in different clusters as a result of increased driving activity and, subsequently, an increased number of crashes and near-crashes. I am planning to build off this by determining whether non-resident drivers are more likely to be at-fault and whether non-resident drivers are more likely to engage in unsafe behaviors, such as distracted driving.
I am currently in the process of conducting approximate permutation tests to quantitatively confirm the validity of these findings, and I will write a journal article that further describes the transportation-related inequities faced by people living in underserved areas. I look forward to presenting my findings at El Instituto once my research is complete, and I am truly appreciative for receiving these awards.